Hey, remember that time Uber posted a blog article on its users' one night stands? You know, the one that proved in full effect that Uber has zero regard for its riders' privacy and data?
And remember when they deleted the post and pretended like it never happened?
We certainly do!
We've found the cached version of the blog post and have pasted the article in its entirety down below. Enjoy.
And remember when they deleted the post and pretended like it never happened?
We certainly do!
We've found the cached version of the blog post and have pasted the article in its entirety down below. Enjoy.
Today we’re going to get a little emotional. You know that Uber loves you and well, gosh, sometimes it’s nice to think that you love us, too. But we know we’re not the only ones in your life and we know that you sometimes look for love elsewhere. Well, while you’re out loving other human beings, we #UberData nerds are cuddled up with our computers, loving math.
Recently, I have come to understand that some of you may have—and I’m not pointing any fingers here or anything—on occasion found love that you might immediately regret upon waking up the morning after. Let’s talk about that. In times of yore you would have woken up in a panic, scrambling in the dark trying to find your fur coat or velvet smoking jacket or whatever it is you cool kids wear. Then that long walk home in the pre-morning dawn. But that was then.
The world has changed, and gone are the days of the Walk of Shame. We live in Uber’s world now.
One of the neat things we can do with our data is discover rider patterns: are there weekend riders that only use Uber post-party? What about the workday commuters who use us every morning? It was while playing around with this idea of (blind!) rider segmentation that we came up with the Ride of Glory (RoG). A RoGer is anyone who took a ride between 10pm and 4am on a Friday or Saturday night, and then took a second ride from within 1/10th of a mile of the previous nights’ drop-off point 4-6 hours later (enough for a quick night’s sleep). (This time window may not be the best, but small changes don’t change the overall pattern.)
Here are the numbers for 6 of the US cities we’re in:
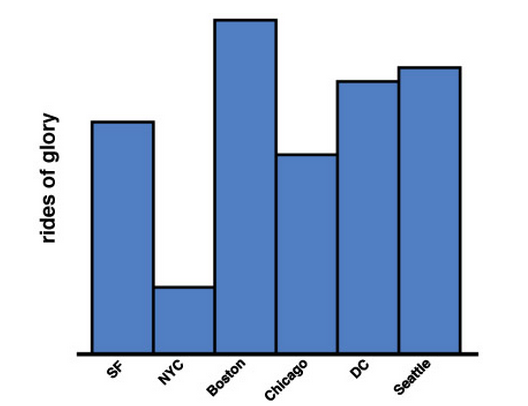
Boston comes in nearly 1% of all rides being Rides of Glory. They clearly top the list! New York has about 1/5 that proportion. Clearly New Yorkers and Bostonians differ in more than just baseball.
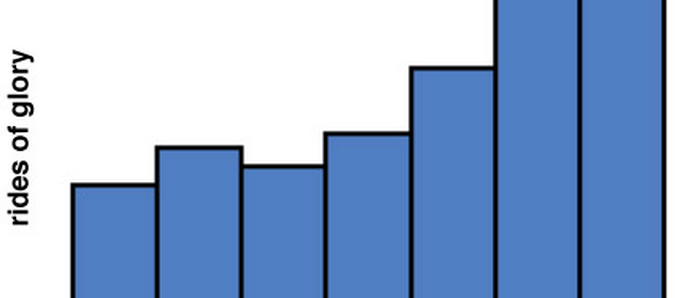
Next, let’s see how the proportion of Rides of Glory changes across time to see if there were any clear temporal patterns. Obviously we removed the “weekend night” restriction of our RoGer definition , but otherwise calculated these the same way across all our cities:
Next, let’s see how the proportion of Rides of Glory changes across time to see if there were any clear temporal patterns. Obviously we removed the “weekend night” restriction of our RoGer definition , but otherwise calculated these the same way across all our cities:
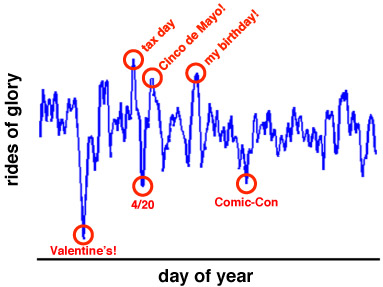
“Brief overnight weekend stays” dropped precipitously during the days surrounding Valentine’s Day. The patterns are fascinating. The highest peak is right around tax day (April 15)…. and this one might make sense. Lots of people are getting an influx of cash in the form of a tax refund and--as we’ve already shown —an influx of cash might be making people more… “frisky”.
Amusingly, after tax day there’s a sharp drop again right around 4/20. Is there something happening that day such that people are otherwise too preoccupied? There’s another big spike on Cinco de Mayo, and then not much happens until mid-June when there’s another big peak. My birthday just happens to be in mid-June, and I’m honored you’re celebrating! Finally, there’s a small lull toward the end of July. Either people are being too lazy in the mid-summer heat, or everyone’s gone off to Comic-Con!
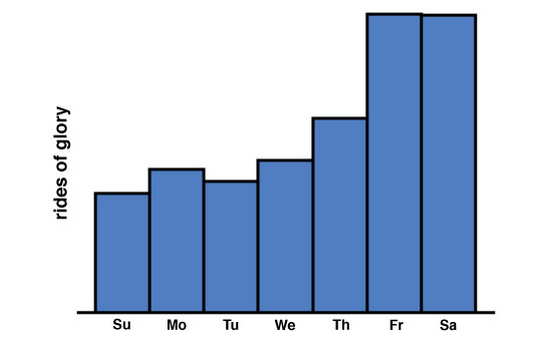
The temporal pattern of Rides of Glory is such that there’s a strong 7-day lag autocorrelation. In other words, there is week-to-week similarity in Rides of Glory, and unsurprisingly they’re more likely to happen on weekends, even when controlling for the normal increase in ridership we see on weekends.
Amusingly, after tax day there’s a sharp drop again right around 4/20. Is there something happening that day such that people are otherwise too preoccupied? There’s another big spike on Cinco de Mayo, and then not much happens until mid-June when there’s another big peak. My birthday just happens to be in mid-June, and I’m honored you’re celebrating! Finally, there’s a small lull toward the end of July. Either people are being too lazy in the mid-summer heat, or everyone’s gone off to Comic-Con!
The temporal pattern of Rides of Glory is such that there’s a strong 7-day lag autocorrelation. In other words, there is week-to-week similarity in Rides of Glory, and unsurprisingly they’re more likely to happen on weekends, even when controlling for the normal increase in ridership we see on weekends.
We also wanted to know which general neighborhood Rides of Glory were more likely to come from. That is, for people who took a Ride of Glory the next morning, where were they comingfrom the night before? Here’s what the maps look like for the various cities. Here’s the proportion of Rides of Glory compared to normal rides:
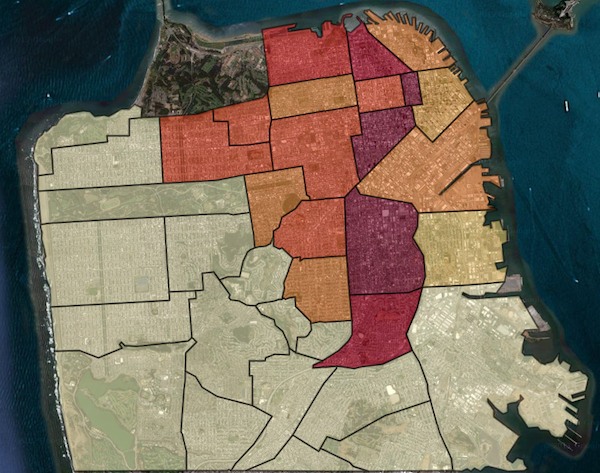
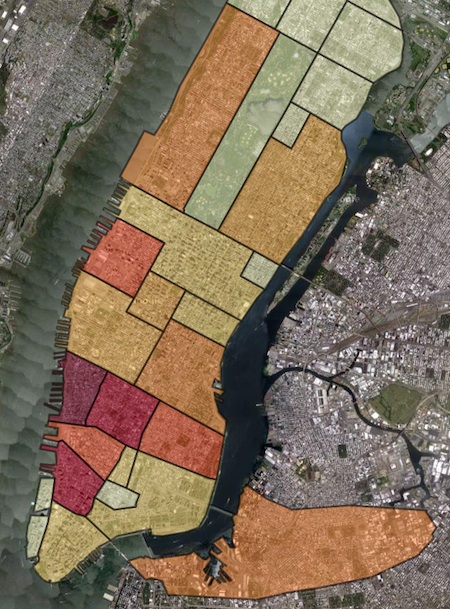

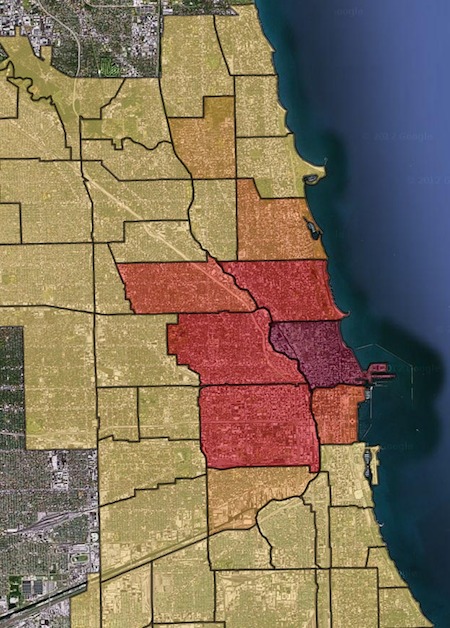


If you’re looking to avoid this kind of thing, consider this a handy neighborhood guide:
The greater the male/female ratio, the more likely that neighborhood had a Ride of Glory.
- San Francisco: Chinatown, the Mission, Downtown, Bernal Heights, Russian Hill, the Marina, Castro-Upper Market
- New York: West Village, Greenwich Village, Tribeca, Soho, Clinton, East Village, the Upper West Side, and Williamsburg
- Boston: Central, Back Bay-Beacon Hill, South Boston, South End, Fenway-Kenmore
- Chicago: Near North Side, West Town, Lincoln Park, Near West Side, Loop
- DC: Downtown, Dupont Circle, U Street Corridor, Adams Morgan, Georgetown, Foggy Bottom, Capitol Hill, Logan Circle
- Seattle: Capitol Hill, Downtown, Belltown, Lower Queen Anne, Ballard, First Hill
The greater the male/female ratio, the more likely that neighborhood had a Ride of Glory.
 RSS Feed